概述
分布式追踪是一种跟踪应用程序请求流经不同服务(如前端、后端、数据库等)的过程。它是一个强大的工具,可以帮助您了解应用程序的工作原理并调试性能问题。
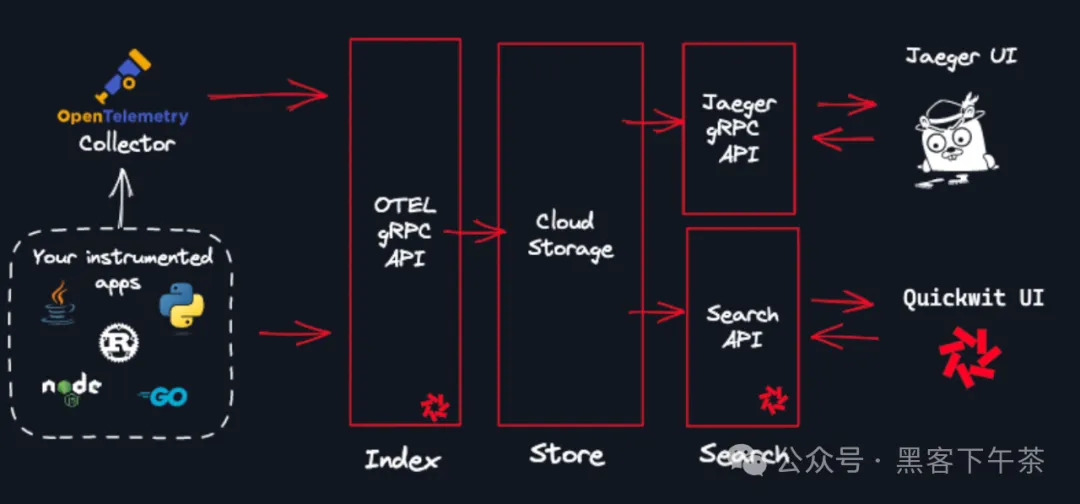
Quickwit 是一个用于索引和搜索非结构化数据的云原生引擎,这使其非常适合用作追踪数据的后端。
此外,Quickwit 本地支持 OpenTelemetry gRPC 和 HTTP(仅 protobuf)协议 以及 Jaeger gRPC API(仅 SpanReader)。这意味着您可以使用 Quickwit 存储追踪数据,并通过 Jaeger UI 查询这些数据。
- https://opentelemetry.io/docs/reference/specification/protocol/otlp/
- https://www.jaegertracing.io/
将 Quickwit 连接到 Jaeger
Quickwit 实现了一个与 Jaeger UI 兼容的 gRPC 服务。您只需要将 Jaeger 配置为使用 grpc-plugin 类型的(跨度)存储,就能够查看存储在任何匹配模式 otel-traces-v0_* 的 Quickwit 索引中的追踪数据。
官方制作了一个关于 如何将 Quickwit 连接到 Jaeger UI 的教程,将引导您完成整个过程。
- https://quickwit.io/docs/distributed-tracing/plug-quickwit-to-jaeger
向 Quickwit 发送追踪数据
- 使用 OTEL collector
- https://quickwit.io/docs/distributed-tracing/send-traces/using-otel-collector
- 使用 Python OTEL SDK
- https://quickwit.io/docs/distributed-tracing/send-traces/using-otel-sdk-python
将 Quickwit 连接至 Jaeger
我们将 Quickwit 的追踪数据发送到 Jaeger 并进行分析,这将生成新的追踪数据以供分析 😃
启动 Quickwit
首先,启动一个启用了 OTLP 服务的 Quickwit 实例:
- https://quickwit.io/docs/get-started/installation
QW_ENABLE_OPENTELEMETRY_OTLP_EXPORTER=true \
OTEL_EXPORTER_OTLP_ENDPOINT=http://127.0.0.1:7281 \
./quickwit run
我们还设置了 QW_ENABLE_OPENTELEMETRY_OTLP_EXPORTER 和 OTEL_EXPORTER_OTLP_ENDPOINT 环境变量,以便 Quickwit 将其自身的追踪数据发送给自己。
启动 Jaeger UI
让我们使用 Docker 启动一个 Jaeger UI 实例。在这里我们需要告知 Jaeger 使用 Quickwit 作为其后端。
由于一些与容器网络相关的特殊性,我们需要在 MacOS 和 Windows 上采用一种方法,在 Linux 上采用另一种方法。
MacOS 与 Windows
我们可以依赖 host.docker.internal 来获取指向我们 Quickwit 服务器的 Docker 桥接 IP 地址。
docker run --rm --name jaeger-qw \-e SPAN_STORAGE_TYPE=grpc-plugin \-e GRPC_STORAGE_SERVER=host.docker.internal:7281 \-p 16686:16686 \jaegertracing/jaeger-query:latest
Linux
默认情况下,Quickwit 监听 127.0.0.1,并且不会响应指向 Docker 桥接 (172.17.0.1) 的请求。解决此问题有多种方法。最简单的方法可能是使用主机网络模式。
docker run --rm --name jaeger-qw --network=host \-e SPAN_STORAGE_TYPE=grpc-plugin \-e GRPC_STORAGE_SERVER=127.0.0.1:7281 \-p 16686:16686 \jaegertracing/jaeger-query:latest在 Jaeger UI 中搜索追踪数据
由于 Quickwit 会索引其自身的追踪数据,因此在大约 5 秒后(这是 Quickwit 完成首次提交所需的时间),您应该能够在 Jaeger UI 中看到这些数据。
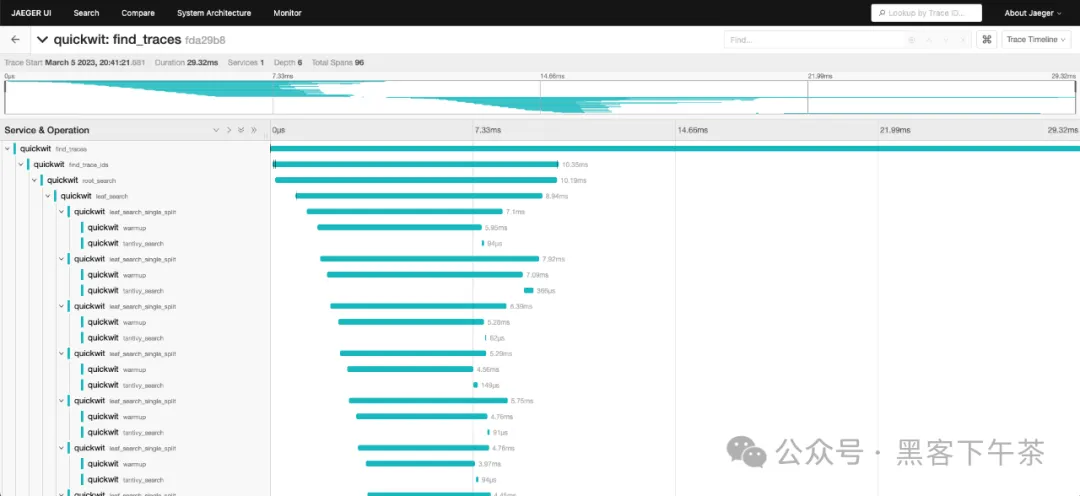
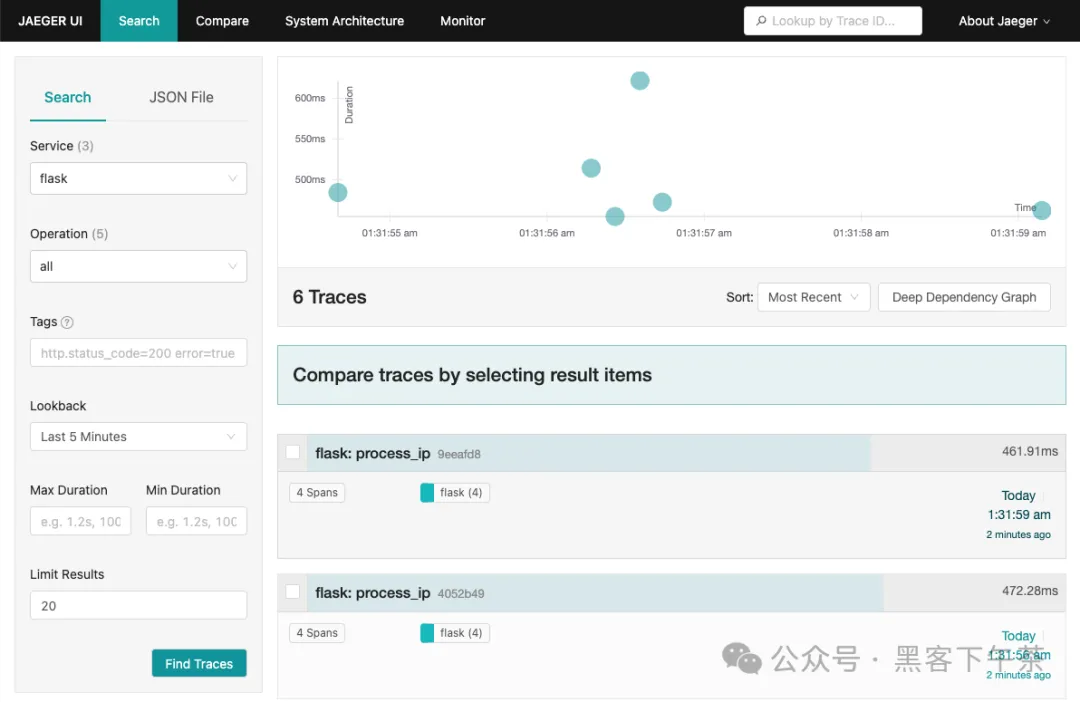
打开位于 http://localhost:16686 的 Jaeger UI 并搜索追踪数据!通过执行搜索查询,您将看到 Quickwit 自身的追踪数据:
find_traces是在 Jaeger UI 中搜索追踪数据时调用的端点,随后它会调用find_trace_ids。find_traces_ids对跨度执行聚合查询以获取唯一的追踪 ID。root_search是 Quickwit 的搜索入口点。它会在每个分片(索引的一部分)上并行地或分布式地调用搜索,如果只有一个节点,则仅在本地调用。leaf_search是每个节点上的搜索入口点。它会在每个分片上调用leaf_search_single_split。leaf_search_single_split是分片上的搜索入口点。它会依次调用warmup和tantivy_search。warmup是搜索的预热阶段。它预取执行搜索查询所需的数据。tantivy_search是搜索的执行阶段。它使用 Tantivy 高速执行搜索查询。
使用 OTEL Collector
如果您已经有自己的 OpenTelemetry Collector 并希望将跟踪数据导出到 Quickwit,您需要在 config.yaml 中添加一个新的 OTLP gRPC 导出器:
macOS/Windows
receivers:otlp:protocols:grpc:http:processors:batch:exporters:otlp/quickwit:endpoint: host.docker.internal:7281tls:insecure: true# By default, traces are sent to the otel-traces-v0_7.# You can customize the index ID By setting this header.# headers:# qw-otel-traces-index: otel-traces-v0_7service:pipelines:traces:receivers: [otlp]processors: [batch]exporters: [otlp/quickwit]
Linux
receivers:otlp:protocols:grpc:http:processors:batch:exporters:otlp/quickwit:endpoint: 127.0.0.1:7281tls:insecure: trueservice:pipelines:traces:receivers: [otlp]processors: [batch]exporters: [otlp/quickwit]
测试您的 OTEL 配置
- 安装 并启动一个 Quickwit 服务器:
- https://quickwit.io/docs/get-started/installation
./quickwit run
- 使用之前的配置启动一个收集器:
macOS/Windows
docker run -v ${PWD}/otel-collector-config.yaml:/etc/otelcol/config.yaml -p 4317:4317 -p 4318:4318 -p 7281:7281 otel/opentelemetry-collector
Linux
docker run -v ${PWD}/otel-collector-config.yaml:/etc/otelcol/config.yaml --network=host -p 4317:4317 -p 4318:4318 -p 7281:7281 otel/opentelemetry-collector
- 使用 cURL 向收集器发送一个跟踪:
curl -XPOST "http://localhost:4318/v1/traces" -H "Content-Type: application/json" \
--data-binary @- << EOF
{"resource_spans": [{"resource": {"attributes": [{"key": "service.name","value": {"string_value": "test-with-curl"}}]},"scope_spans": [{"scope": {"name": "manual-test"},"spans": [{"time_unix_nano": "1678974011000000000","observed_time_unix_nano": "1678974011000000000","start_time_unix_nano": "1678974011000000000","end_time_unix_nano": "1678974021000000000","trace_id": "3c191d03fa8be0653c191d03fa8be065","span_id": "3c191d03fa8be065","kind": 2,"events": [],"status": {"code": 1}}]}]}]
}
EOF
您应该会在 Quickwit 服务器上看到类似于以下的日志:
2023-03-16T13:44:09.369Z INFO quickwit_indexing::actors::indexer: new-split split_id="01GVNAKT5TQW0T2QGA245XCMTJ" partition_id=6444214793425557444
这意味着 Quickwit 已经接收到跟踪并创建了一个新的分片。在搜索跟踪之前,请等待分片发布。
使用 OTEL SDK - Python
在本教程中,我们将向您展示如何使用 OpenTelemetry 为 Python Flask 应用程序进行仪器化,并将跟踪数据发送到 Quickwit。本教程受到 Python OpenTelemetry 文档的启发,感谢 OpenTelemetry 团队!
- https://flask.palletsprojects.com/en/2.2.x/
- https://opentelemetry.io/docs/instrumentation/python/getting-started/
前提条件
- 已安装 Python3
- 已安装 Docker
启动一个 Quickwit 实例
安装 Quickwit 并启动一个 Quickwit 实例:
- https://quickwit.io/docs/main-branch/get-started/installation
./quickwit run
启动 Jaeger UI
让我们使用 Docker 启动一个 Jaeger UI 实例。在这里我们需要告知 Jaeger 使用 Quickwit 作为其后端。
由于容器网络的一些特殊性,我们将在 MacOS 和 Windows 以及 Linux 上采用不同的方法。
MacOS 和 Windows
我们可以依赖 host.docker.internal 获取指向我们 Quickwit 服务器的 Docker 桥接 IP 地址。
docker run --rm --name jaeger-qw \-e SPAN_STORAGE_TYPE=grpc-plugin \-e GRPC_STORAGE_SERVER=host.docker.internal:7281 \-p 16686:16686 \jaegertracing/jaeger-query:latest
Linux
默认情况下,Quickwit 监听的是 127.0.0.1,并且不会响应指向 Docker 桥接 (172.17.0.1) 的请求。有多种方法可以解决这个问题。
最简单的方法可能是使用主机网络模式。
docker run --rm --name jaeger-qw --network=host \-e SPAN_STORAGE_TYPE=grpc-plugin \-e GRPC_STORAGE_SERVER=127.0.0.1:7281 \-p 16686:16686 \jaegertracing/jaeger-query:latest运行一个简单的 Flask 应用
我们将启动一个 Flask 应用程序,该程序在每个 HTTP 调用 http://localhost:5000/process-ip 上执行三件事:
- 从 https://httpbin.org/ip 获取 IP 地址。
- 解析它,并使用随机休眠进行伪造处理。
- 以随机休眠时间显示它。
我们首先安装依赖项:
pip install flask
pip install opentelemetry-distro
pip install opentelemetry-exporter-otlp
opentelemetry-distro 包会安装 API、SDK 以及您将使用的 opentelemetry-bootstrap 和 opentelemetry-instrument 工具。
以下是我们的应用代码:
import random
import time
import requestsfrom flask import Flaskapp = Flask(__name__)@app.route("/process-ip")
def process_ip():body = fetch()ip = parse(body)display(ip)return ipdef fetch():resp = requests.get('https://httpbin.org/ip')body = resp.json()return bodydef parse(body):# Sleep for a random amount of time to make the span more visible.secs = random.randint(1, 100) / 1000time.sleep(secs)return body["origin"]def display(ip):# Sleep for a random amount of time to make the span more visible.secs = random.randint(1, 100) / 1000time.sleep(secs)message = f"Your IP address is `{ip}`."print(message)if __name__ == "__main__":app.run(port=5000)
自动 Instrumentation
OpenTelemetry 提供了一个名为 opentelemetry-bootstrap 的工具,它可以自动为您仪器化 Python 应用程序。
opentelemetry-bootstrap -a install
现在一切就绪,我们可以运行应用了:
# We don't need metrics.
OTEL_METRICS_EXPORTER=none \
OTEL_TRACES_EXPORTER=console \
OTEL_SERVICE_NAME=my_app \
python my_app.py
通过访问 http://localhost:5000/process-ip,您应该能在控制台看到相应的跟踪记录。
这已经很好了,但如果我们可以记录每个步骤所花费的时间、获取 HTTP 请求的状态码以及响应的内容类型,那就更好了。让我们通过手动仪器化我们的应用来实现这一点!
手动 Instrumentation
import random
import time
import requestsfrom flask import Flaskfrom opentelemetry import trace# Creates a tracer from the global tracer provider
tracer = trace.get_tracer(__name__)app = Flask(__name__)@app.route("/process-ip")
@tracer.start_as_current_span("process_ip")
def process_ip():body = fetch()ip = parse(body)display(ip)return ip@tracer.start_as_current_span("fetch")
def fetch():resp = requests.get('https://httpbin.org/ip')body = resp.json()headers = resp.headerscurrent_span = trace.get_current_span()current_span.set_attribute("status_code", resp.status_code)current_span.set_attribute("content_type", headers["Content-Type"])current_span.set_attribute("content_length", headers["Content-Length"])return body@tracer.start_as_current_span("parse")
def parse(body):# Sleep for a random amount of time to make the span more visible.secs = random.randint(1, 100) / 1000time.sleep(secs)return body["origin"]@tracer.start_as_current_span("display")
def display(ip):# Sleep for a random amount of time to make the span more visible.secs = random.randint(1, 100) / 1000time.sleep(secs)message = f"Your IP address is `{ip}`."print(message)current_span = trace.get_current_span()current_span.add_event(message)if __name__ == "__main__":app.run(port=5000)
我们现在可以启动新的仪器化应用:
OTEL_METRICS_EXPORTER=none \
OTEL_TRACES_EXPORTER=console \
OTEL_SERVICE_NAME=my_app \
opentelemetry-instrument python my_instrumented_app.py
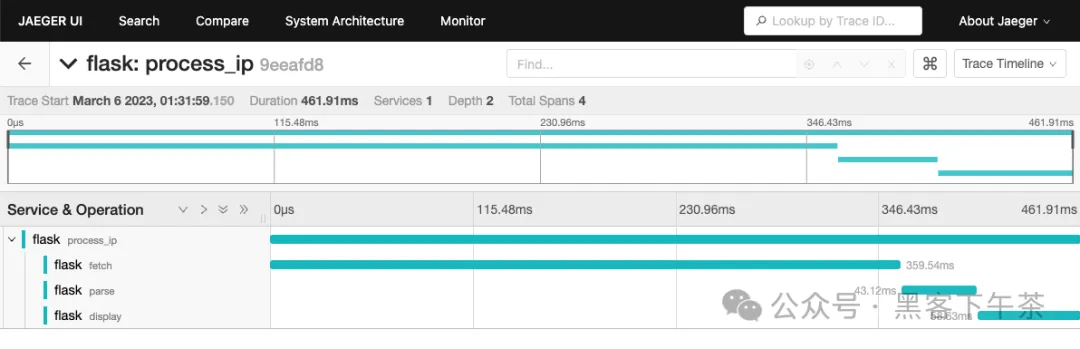
如果您再次访问 http://localhost:5000/process-ip,您应该能看到带有名称 fetch、parse 和 display 的新跨度以及相应的自定义属性!
将跟踪数据发送到 Quickwit
要将跟踪数据发送到 Quickwit,我们需要使用 OTLP 导出器。这非常简单:
OTEL_METRICS_EXPORTER=none \ # We don't need metrics
OTEL_SERVICE_NAME=my_app \
OTEL_EXPORTER_OTLP_TRACES_ENDPOINT=http://localhost:7281 \
opentelemetry-instrument python my_instrumented_app.py
现在,如果您访问 http://localhost:5000/process-ip,跟踪数据将被发送到 Quickwit,只需等待大约 30 秒即可完成索引。是时候休息一下喝杯咖啡了!
30 秒过去了,让我们查询服务的跟踪数据:
curl -XPOST http://localhost:7280/api/v1/otel-trace-v0/search -H 'Content-Type: application/json' -d '{"query": "resource_attributes.service.name:my_app"
}'
然后打开 Jaeger UI localhost:16686 并进行操作,现在您有了一个由 Quickwit 存储后端支持的 Jaeger UI!
将跟踪数据发送到您的 OpenTelemetry 收集器
按照 OpenTelemetry 收集器教程 中的说明启动一个收集器,并执行以下命令:
- https://quickwit.io/docs/distributed-tracing/send-traces/using-otel-collector
OTEL_METRICS_EXPORTER=none \ # We don't need metrics
OTEL_SERVICE_NAME=my_app \
opentelemetry-instrument python instrumented_app.py
跟踪数据将被发送到您的收集器,然后再发送到 Quickwit。
总结
在本教程中,我们学习了如何使用 OpenTelemetry 为 Python 应用程序进行仪器化,并将跟踪数据发送到 Quickwit。同时,我们也了解了如何使用 Jaeger UI 分析这些跟踪数据。
所有的代码片段都可在我们的 教程仓库 中找到。
- https://github.com/quickwit-oss/tutorials
请告诉我们您对本教程的看法,如有任何疑问,欢迎通过 Discord 或 Twitter 与我们联系。
- https://discord.gg/7eNYX4d
- https://twitter.com/quickwit_inc
OTEL service
Quickwit 本地支持 OpenTelemetry 协议 (OTLP),并提供了一个 gRPC 端点来接收来自 OpenTelemetry collector 或直接从应用程序通过 exporter 发送的跨度数据。此端点默认是启用的。
- https://opentelemetry.io/docs/reference/specification/protocol/otlp/
当启用时,Quickwit 将启动 gRPC 服务,准备接收来自 OpenTelemetry collector 的跨度数据。这些跨度数据默认会被索引到 otel-trace-v0_7 索引中,并且如果该索引不存在,它将自动创建。索引文档映射在下一个section中描述。
- https://quickwit.io/docs/distributed-tracing/otel-service#trace-and-span-data-model
如果由于任何原因,您想要禁用这个端点,您可以:
- 在启动 Quickwit 时将环境变量
QW_ENABLE_OTLP_ENDPOINT设置为false。 - 或者配置节点配置,将索引器设置
enable_otlp_endpoint设置为false。- https://quickwit.io/docs/main-branch/configuration/node-config
# ... Indexer configuration ...
indexer:enable_otlp_endpoint: false
在您选择的索引中发送跨度
您可以通过将 gRPC 请求的头部 qw-otel-traces-index 设置为目标索引 ID 来在您选择的索引中发送跨度。
跟踪和跨度数据模型
一个跟踪是一组跨度,表示一个单独的请求。一个跨度表示跟踪内的单个操作。OpenTelemetry 收集器发送跨度,Quickwit 默认将它们索引到 otel-trace-v0_7 索引中,该索引将 OpenTelemetry 的跨度模型映射到 Quickwit 中的索引文档。
跨度模型源自 OpenTelemetry 规范。
- https://opentelemetry.io/docs/reference/specification/trace/api/
下面是 otel-trace-v0_7 索引的文档映射:
version: 0.7index_id: otel-trace-v0_7doc_mapping:mode: strictfield_mappings:- name: trace_idtype: bytesinput_format: hexoutput_format: hexfast: true- name: trace_statetype: textindexed: false- name: service_nametype: texttokenizer: rawfast: true- name: resource_attributestype: jsontokenizer: raw- name: resource_dropped_attributes_counttype: u64indexed: false- name: scope_nametype: textindexed: false- name: scope_versiontype: textindexed: false- name: scope_attributestype: jsonindexed: false- name: scope_dropped_attributes_counttype: u64indexed: false- name: span_idtype: bytesinput_format: hexoutput_format: hex- name: span_kindtype: u64- name: span_nametype: texttokenizer: rawfast: true- name: span_fingerprinttype: texttokenizer: raw- name: span_start_timestamp_nanostype: datetimeinput_formats: [unix_timestamp]output_format: unix_timestamp_nanosindexed: falsefast: truefast_precision: milliseconds- name: span_end_timestamp_nanostype: datetimeinput_formats: [unix_timestamp]output_format: unix_timestamp_nanosindexed: falsefast: false- name: span_duration_millistype: u64indexed: falsefast: true- name: span_attributestype: jsontokenizer: rawfast: true- name: span_dropped_attributes_counttype: u64indexed: false- name: span_dropped_events_counttype: u64indexed: false- name: span_dropped_links_counttype: u64indexed: false- name: span_statustype: jsonindexed: true- name: parent_span_idtype: bytesinput_format: hexoutput_format: hexindexed: false- name: eventstype: array<json>tokenizer: rawfast: true- name: event_namestype: array<text>tokenizer: defaultrecord: positionstored: false- name: linkstype: array<json>tokenizer: rawtimestamp_field: span_start_timestamp_nanosindexing_settings:commit_timeout_secs: 10search_settings:default_search_fields: []
更多
1. Binance 如何使用 Quickwit 构建 100PB 日志服务(Quickwit 博客)


![[WPF]数据绑定时为何会出现StringFormat失效](https://img2024.cnblogs.com/blog/3056716/202408/3056716-20240830130446906-1084937100.png)